Queensland Copper-Gold Project
Mt Isa Region, Queensland
Breakthrough has entered into a binding agreement to acquire the Queensland Copper-Gold Project (QCGP) in the Mt Isa region of Queensland, Australia. The acquisition is unconditional and completion is expected in early March 2026 with the transfer of tenure.
The Project comprises a total of approximately 952km2 of granted tenure including over 21km2 of granted Mining Leases and includes a global Mineral Resource Estimate (MRE) reported in accordance with JORC (2012) comprising 18.8Mt @ 1.07% CuEq for 200kt of contained CuEq metal across the Measured (3%), Indicated (31%) and Inferred (66%) mineral resource categories (refer full table below).
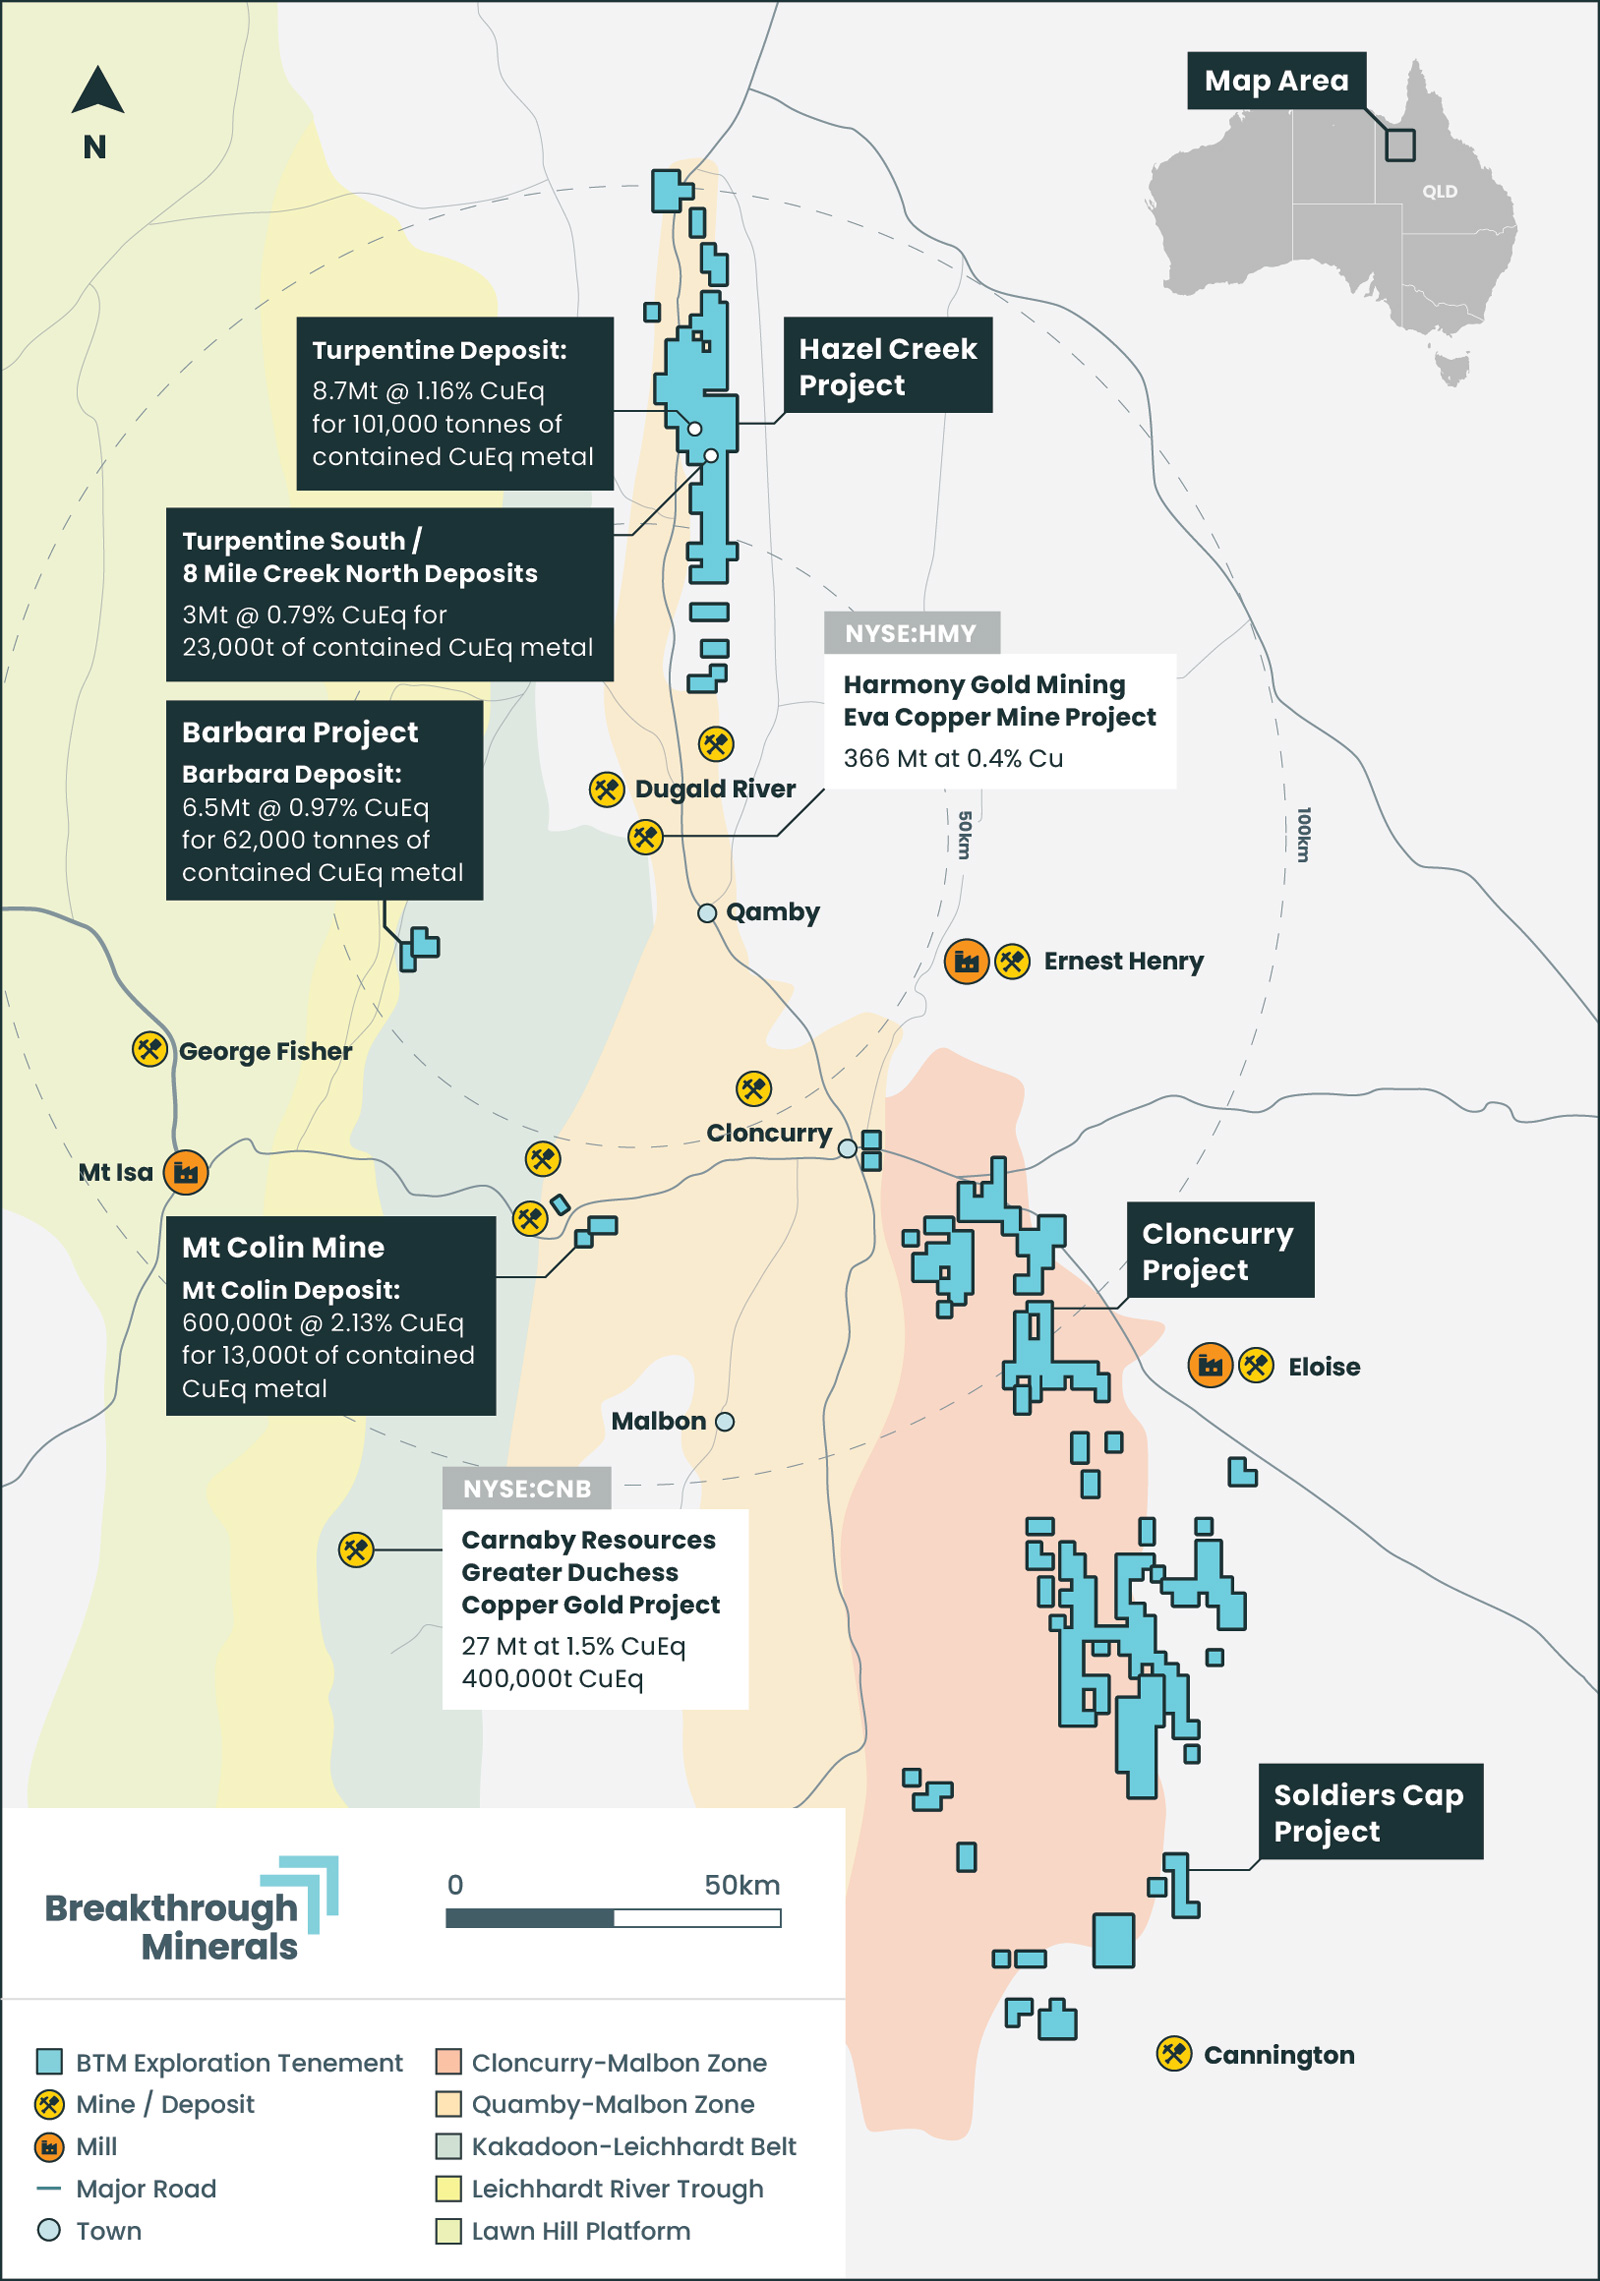
The Project is surrounded by major mining operations and infrastructure. The Hazel Creek and Barbara deposits sit along proven mineralised corridors that have produced multi-million-tonne discoveries.
The QCGP is comprised of 4 project areas as listed below and outlined in Figure 1.
- Hazel Creek Copper-Gold Project (HCCGP) – includes deposits at Turpentine and Turpentine South / Eight Mile Creek North.
- Barbara Copper Gold Project (BCGP) – includes the Barbara deposit.
- Mt Colin Mine Project – includes the Mt Colin deposit.
- Soldiers Cap / Cloncurry Exploration Project.
The Project hosts significant potential to expand on current mineral resources, convert advanced exploration plays into resource and discover new areas of copper and gold mineralisation.
Queensland Copper-Gold Project Global Mineral Resource, reported in accordance with JORC 2012
| Asset | Resource Category | Tonnes (Mt) | Grade | Contained Metal | ||||||
| Cu (%) | Au (g/t) | Ag (g/t) | CuEq (%) | Cu (kt) | Au (koz) | Ag (koz) | CuEq (kt) | |||
| Barbara | Measured | |||||||||
| Indicated | 5.8 | 0.9 | 0.08 | 1.55 | 0.97 | 52 | 15 | 288 | 57 | |
| Inferred | 0.7 | 0.91 | 0.06 | 1.72 | 0.96 | 6 | 1 | 38 | 6 | |
| Total | 6.5 | 0.9 | 0.08 | 1.57 | 0.97 | 58 | 16 | 326 | 63 | |
| Mt Colin | Measured | 0.2 | 2.3 | 0.5 | 2.71 | 5 | 3 | 6 | ||
| Indicated | 0.3 | 1.4 | 0.3 | 1.64 | 4 | 3 | 5 | |||
| Inferred | 0.1 | 1.6 | 0.3 | 1.84 | 2 | 1 | 2 | |||
| Total | 0.6 | 1.8 | 0.4 | 2.13 | 11 | 7 | 13 | |||
| Turpentine | Measured | |||||||||
| Indicated | ||||||||||
| Inferred | 8.7 | 1.03 | 0.16 | 0.34 | 1.16 | 90 | 46 | 96 | 101 | |
| Total | 8.7 | 1.03 | 0.16 | 0.34 | 1.16 | 90 | 46 | 96 | 101 | |
| Turpentine South & Eight Mile Creek North | Measured | |||||||||
| Indicated | ||||||||||
| Inferred | 3 | 0.68 | 0.13 | 0.2 | 0.79 | 20 | 12 | 19 | 23 | |
| Total | 3 | 0.68 | 0.13 | 0.2 | 0.79 | 20 | 12 | 19 | 23 | |
| Total | Measured | 0.2 | 2.3 | 0.5 | 2.71 | 5 | 3 | 6 | ||
| Indicated | 6.1 | 0.93 | 0.09 | 1.55 | 1 | 56 | 18 | 287 | 62 | |
| Inferred | 12.5 | 0.94 | 0.15 | 0.39 | 1.06 | 118 | 60 | 153 | 132 | |
| Total | 18.8 | 0.96 | 0.14 | 0.76 | 1.07 | 179 | 81 | 441 | 200 | |
Notes:
- Mineral Resource Estimates are reported using a variety of cutoff criteria (NSR) depending on which is best suited to each deposit
- Discrepancy in summation may occur due to rounding
For full results including JORC tables, please refer to BTM ASX Announcement 30 October 2025.
